Client
MODIFI
MODIFI
Client
MODIFI
Year
2022
Scope of Work
UX/UI Design · Development
Location
Berlin
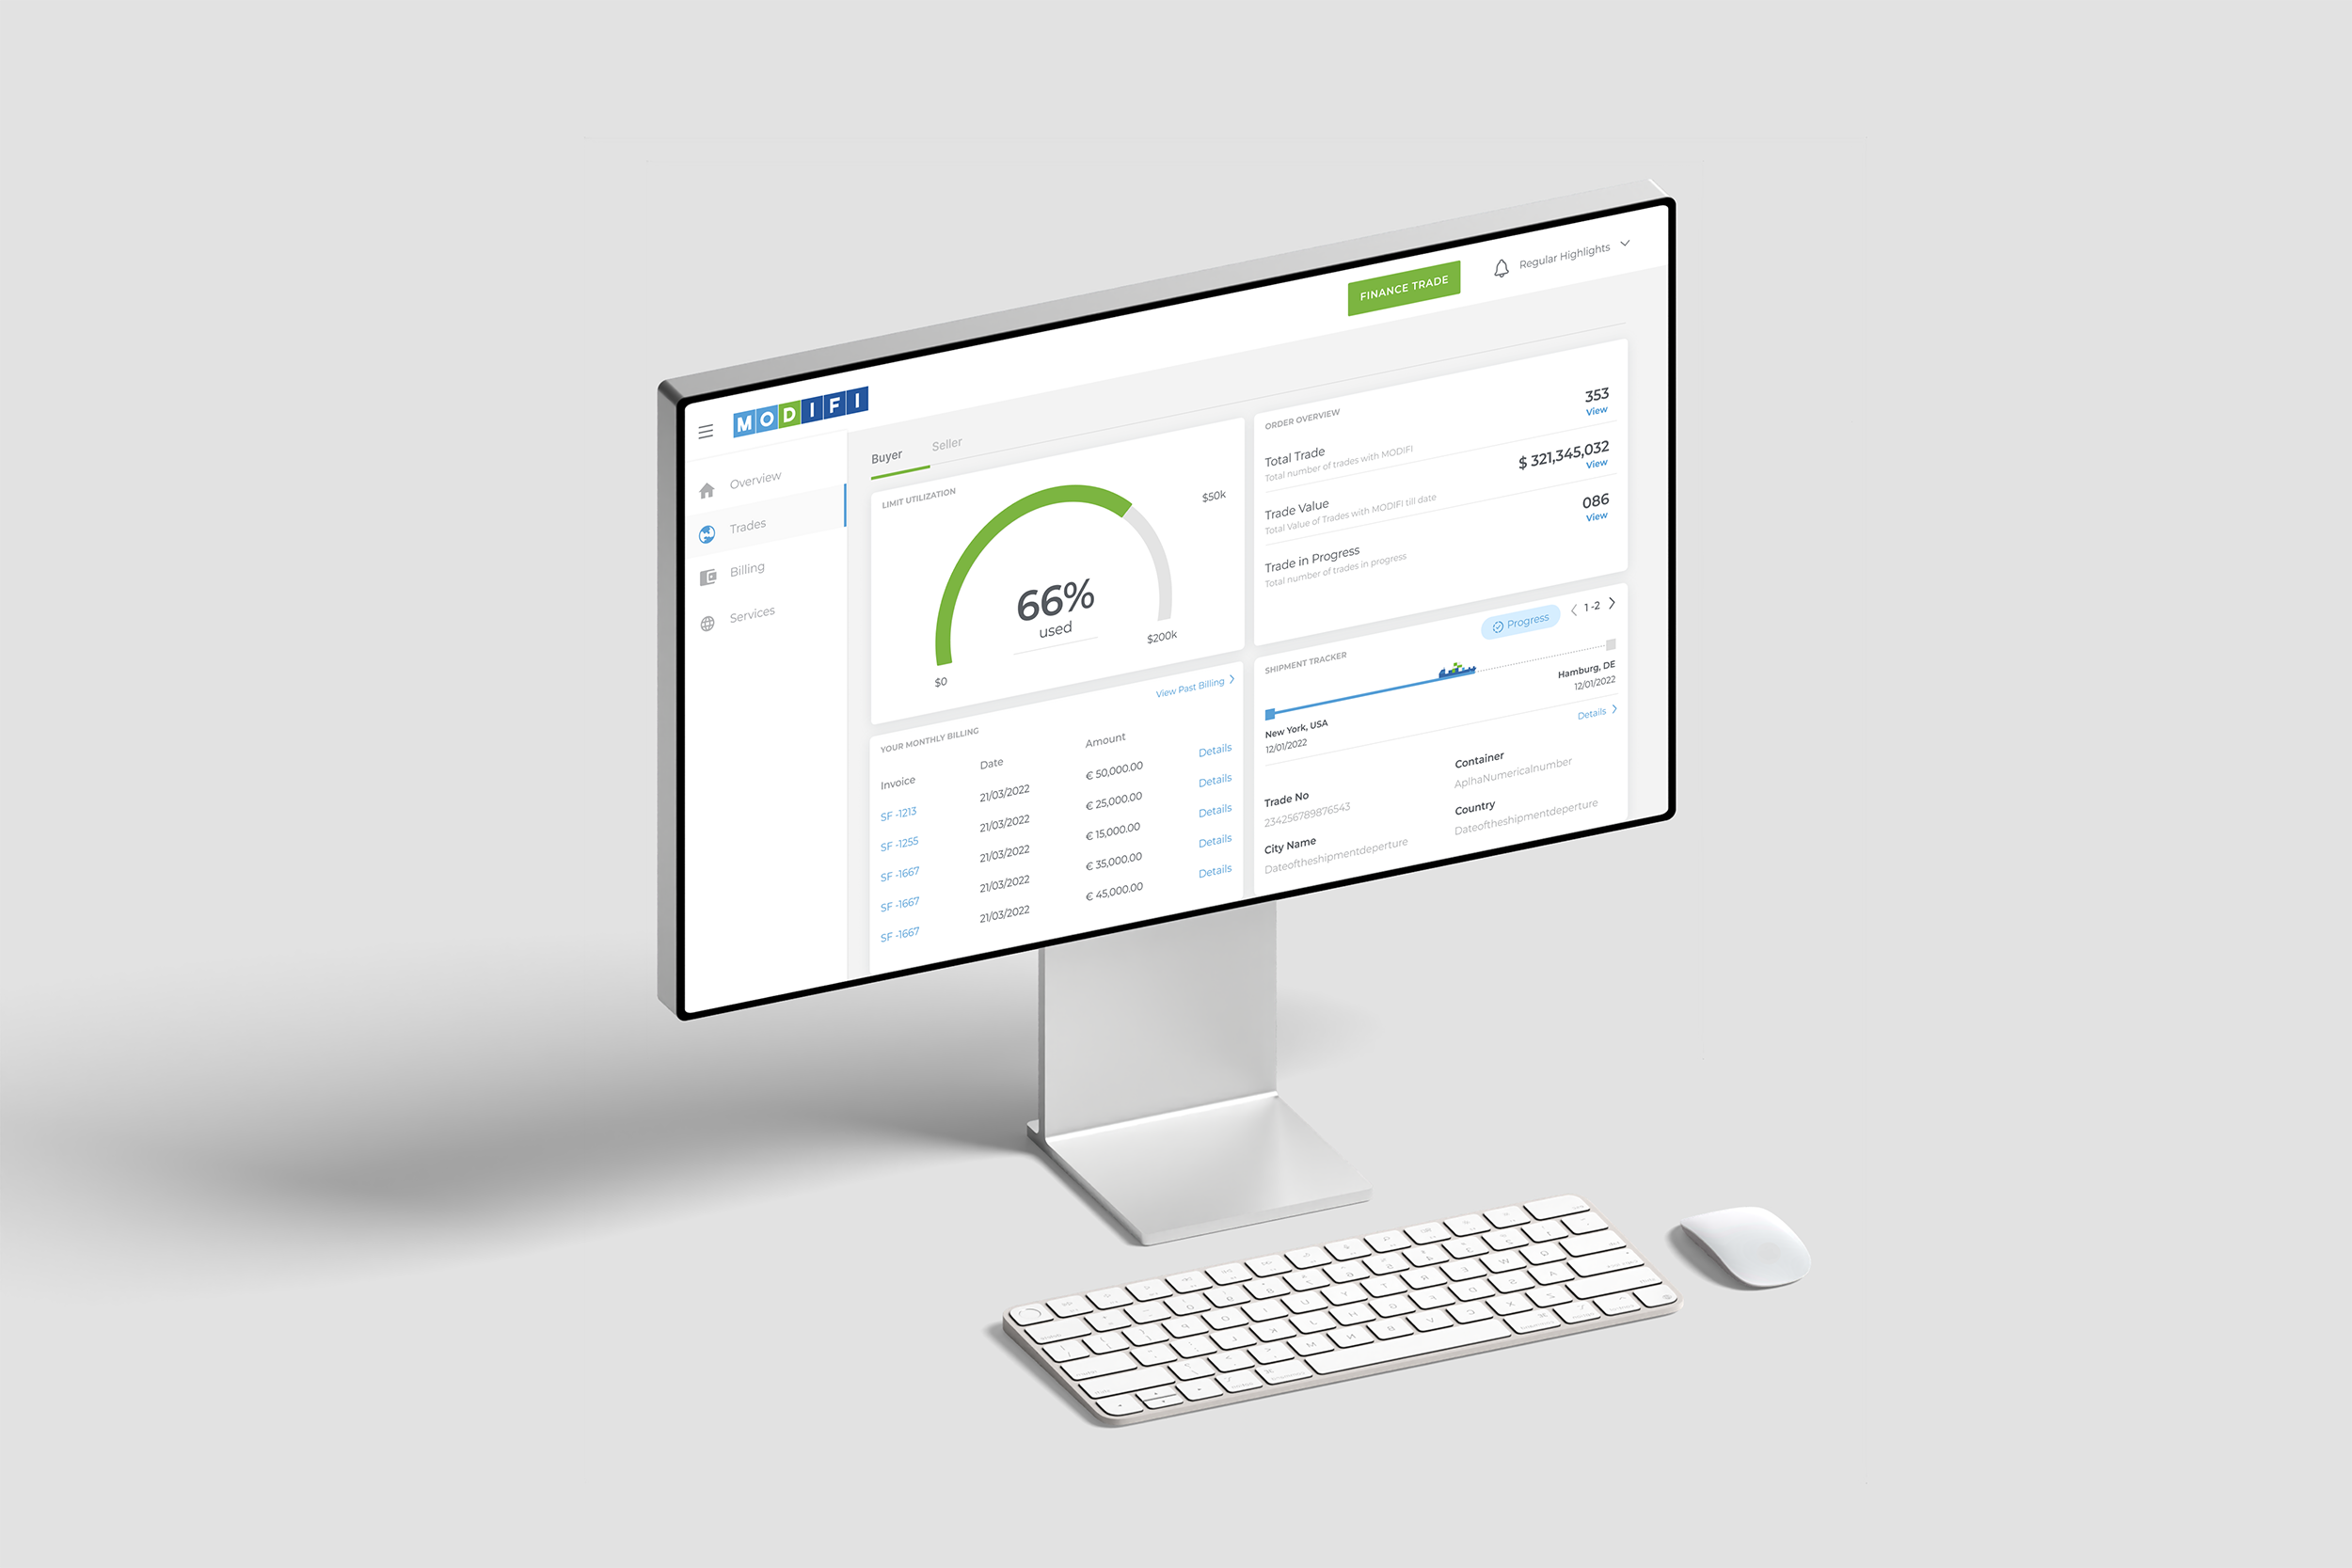
This project focused on improving the usability of MODIFI's financial dashboard, specifically around repayment visibility. The existing experience made it difficult for users to quickly understand what they owed, as repayment details and other key elements were not clearly surfaced.
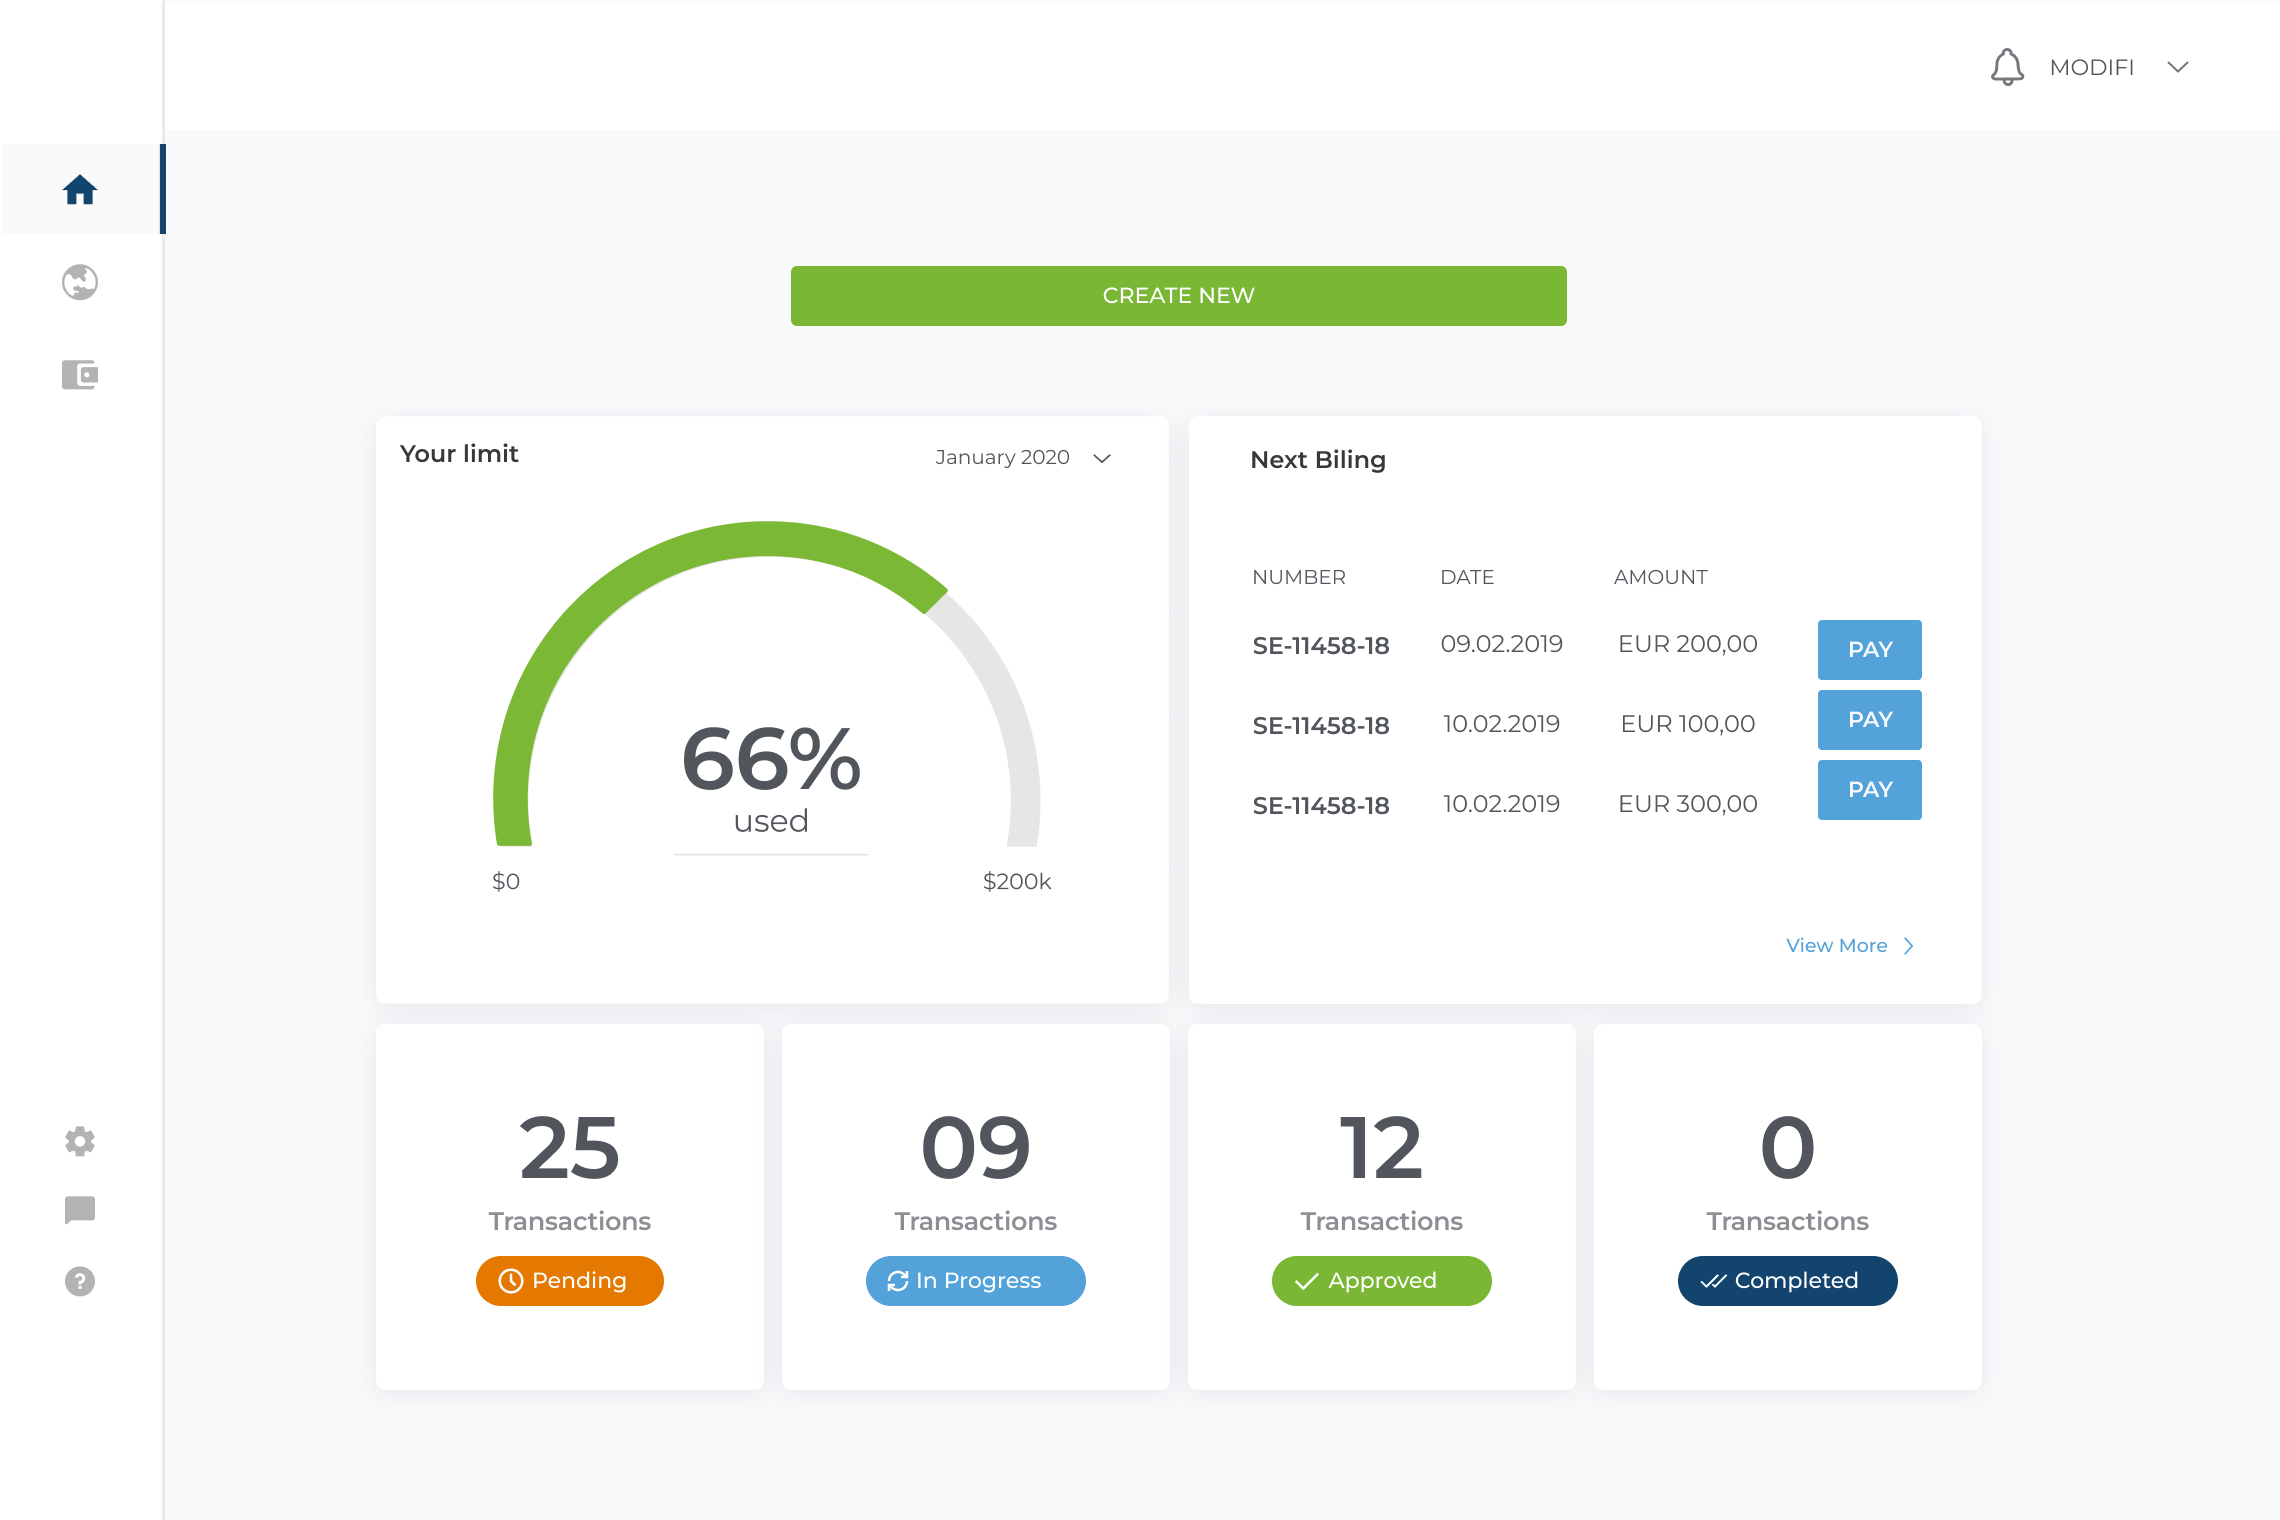
Previous Dashboard Design
Repayment information wasn’t easy to find on the main overview screen. While users could quickly see their credit usage, details about what they owed were hidden or not clearly visible. Important information like due dates and payment amounts didn’t stand out, and there were no clear signals to show urgency. Because of this, users could easily miss upcoming or overdue repayments, making it harder to stay on top of their credit.
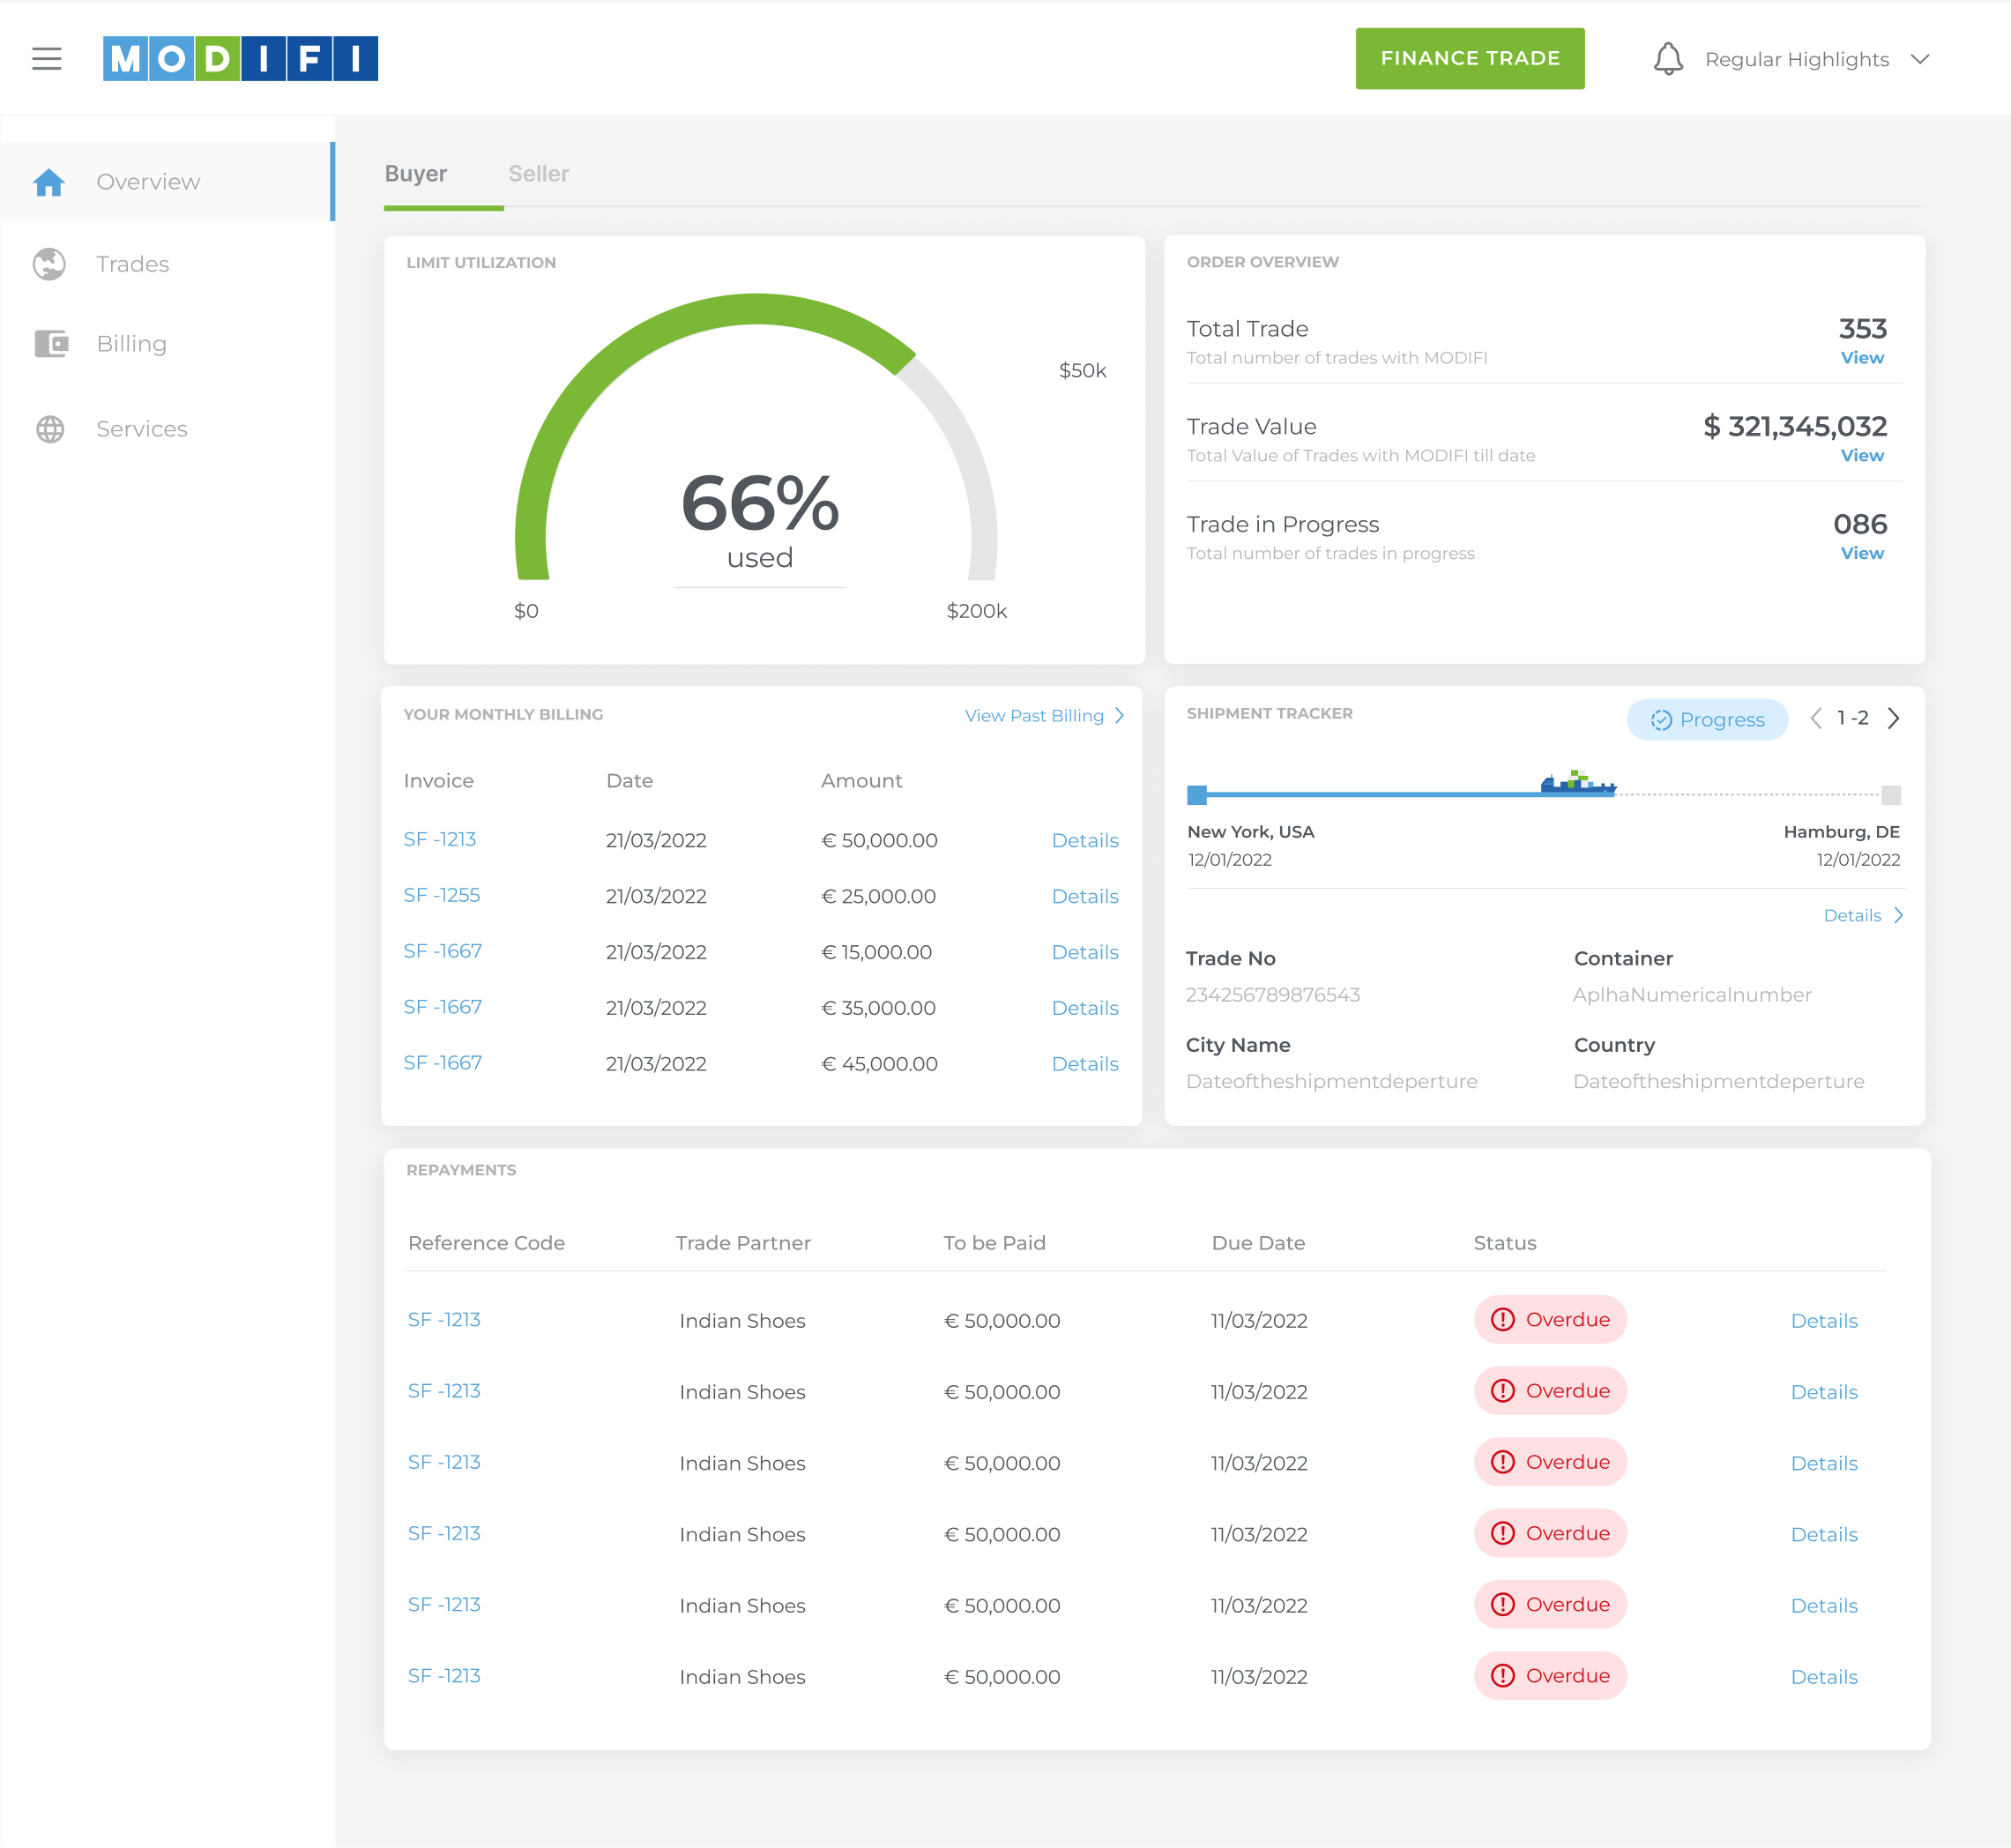
Dashboard Redesign
I introduced a modular grid to better organize information by priority. High-level metrics like limit utilization and trade value are placed at the top, making them immediately visible, while more detailed sections like billing and repayments sit below. This structure creates a clearer visual hierarchy and makes it easier for users to understand their current financial position.
Shipment Tracker View
In the shipment list, I introduced progress lines to show status at a glance instead of relying only solely on labels. This gives users a quick visual sense of where things stand without having to read through each row.
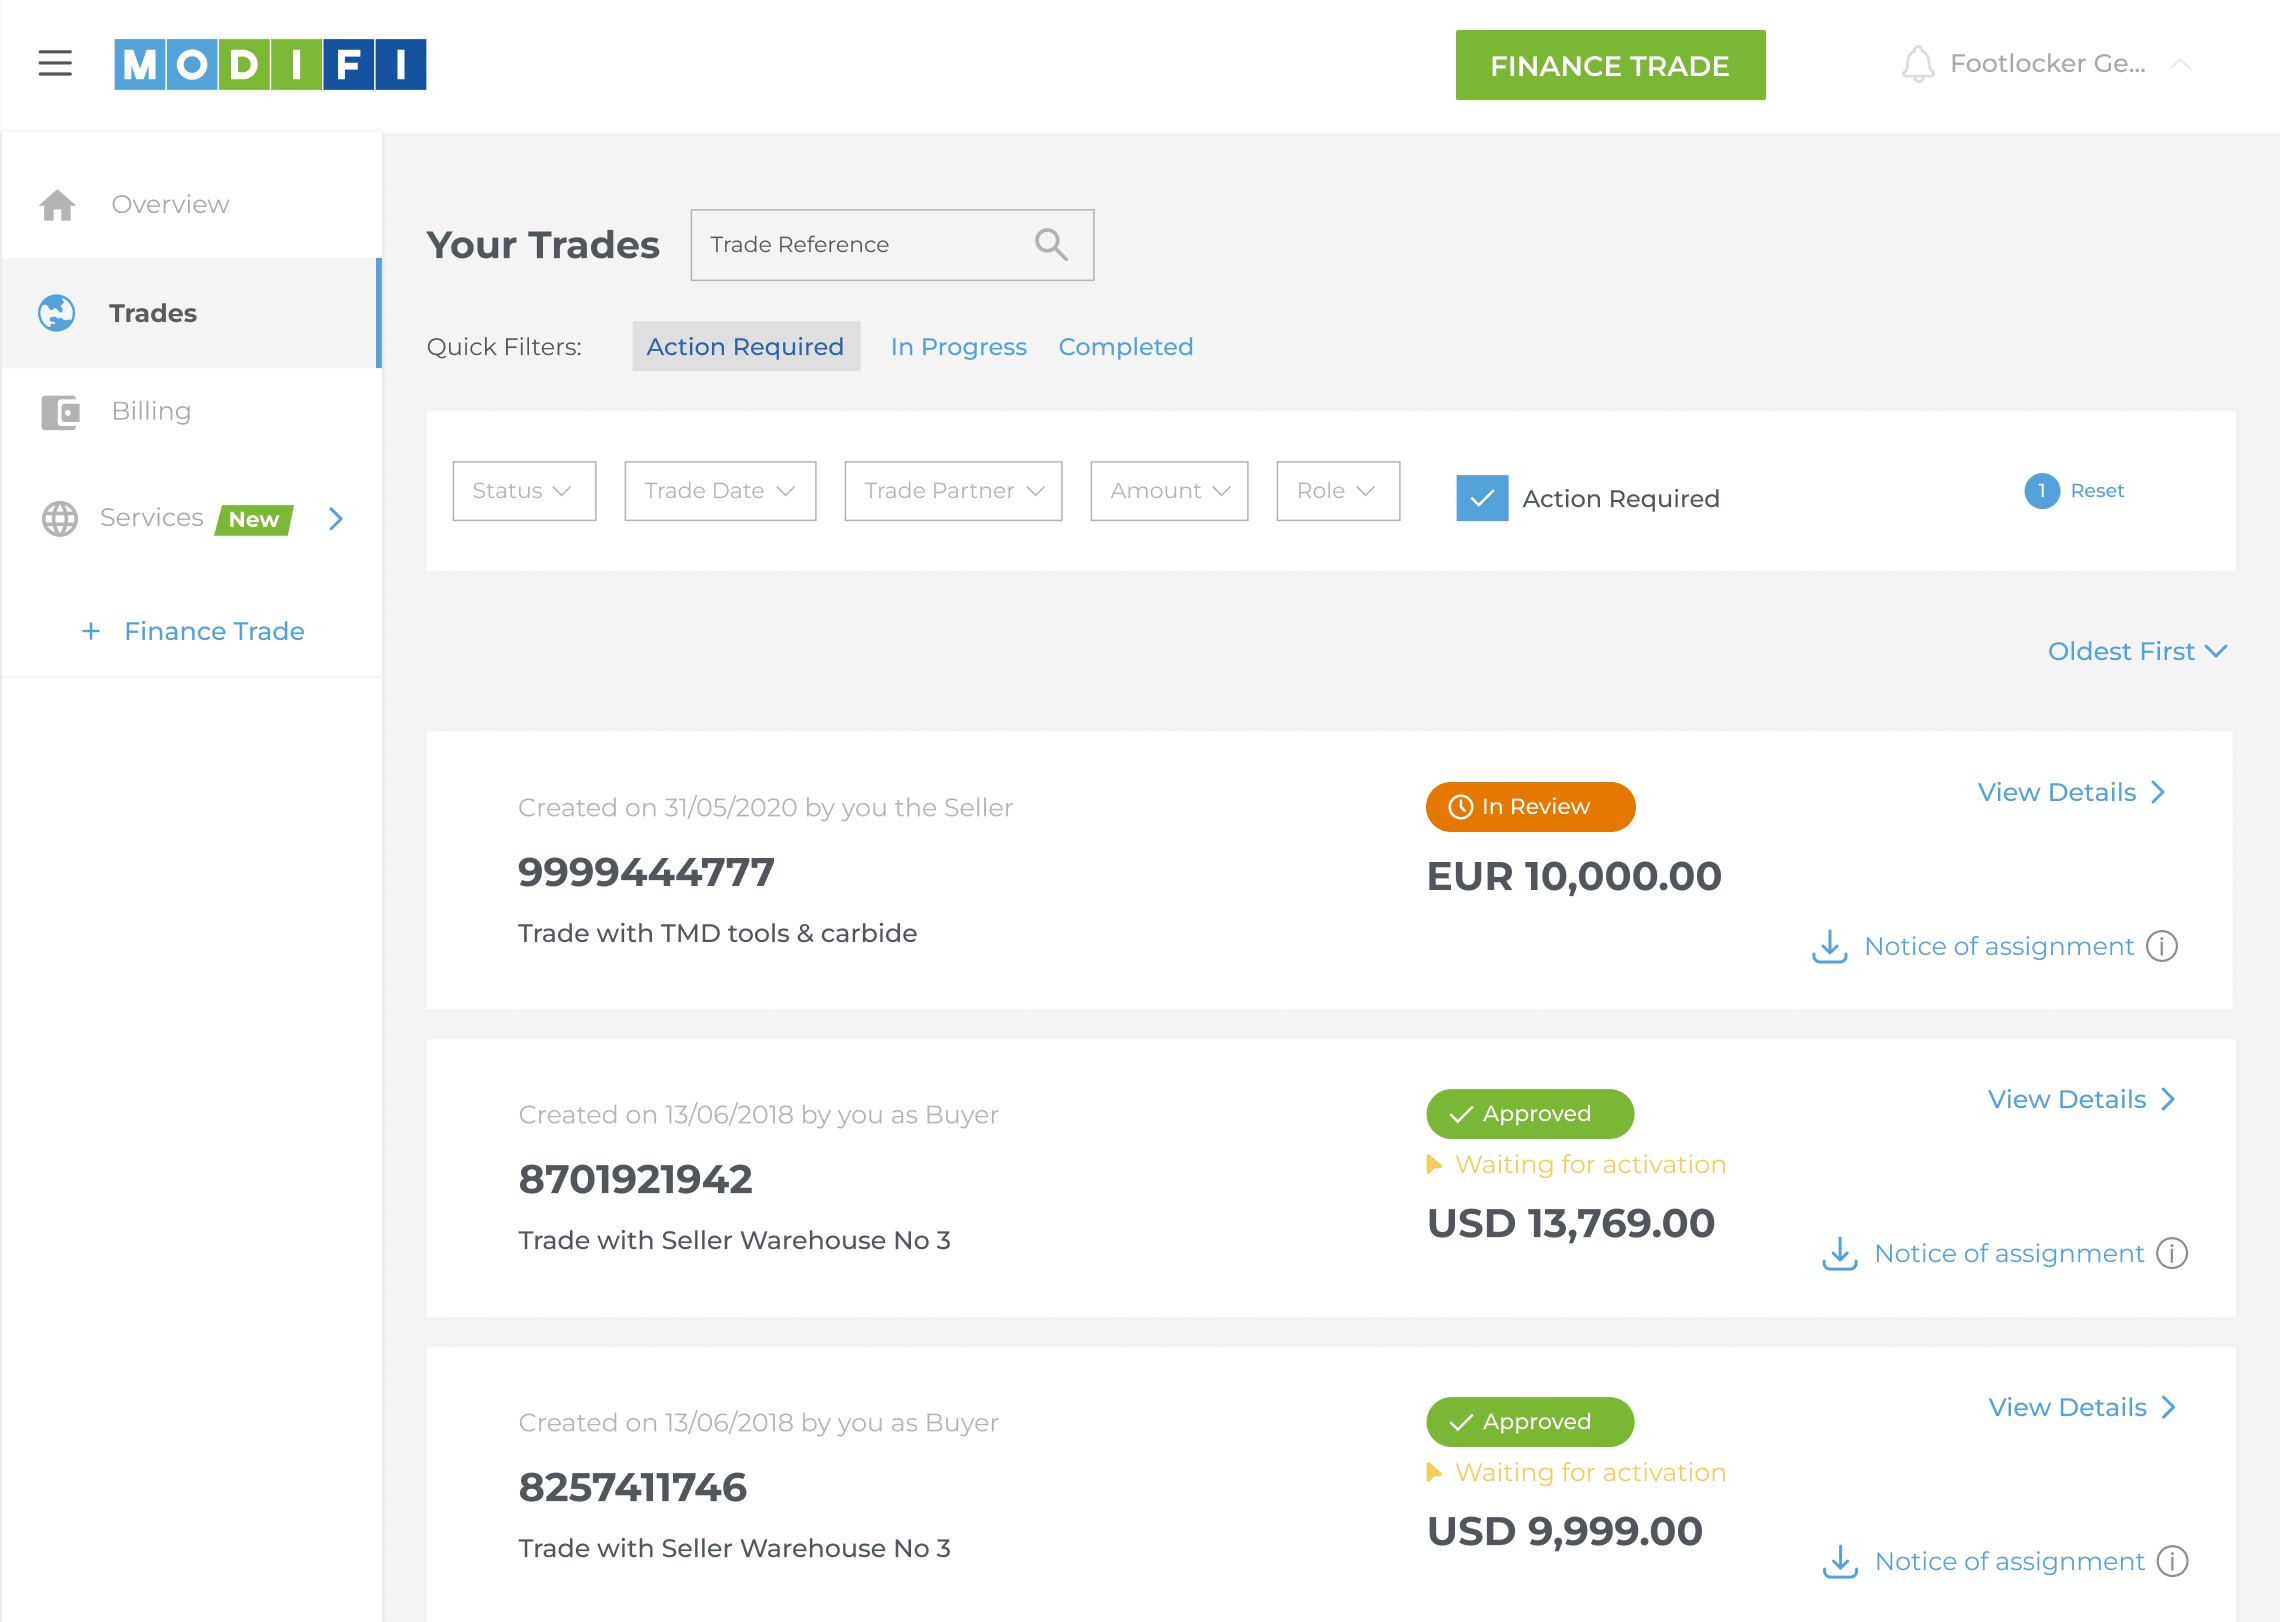
Trade View
I standardized the color-coded status badges so each state is immediately recognizable without needing to read through the details. Supporting states like “waiting for activation” sit underneath as secondary information, so they don’t compete for attention but are still there when needed.
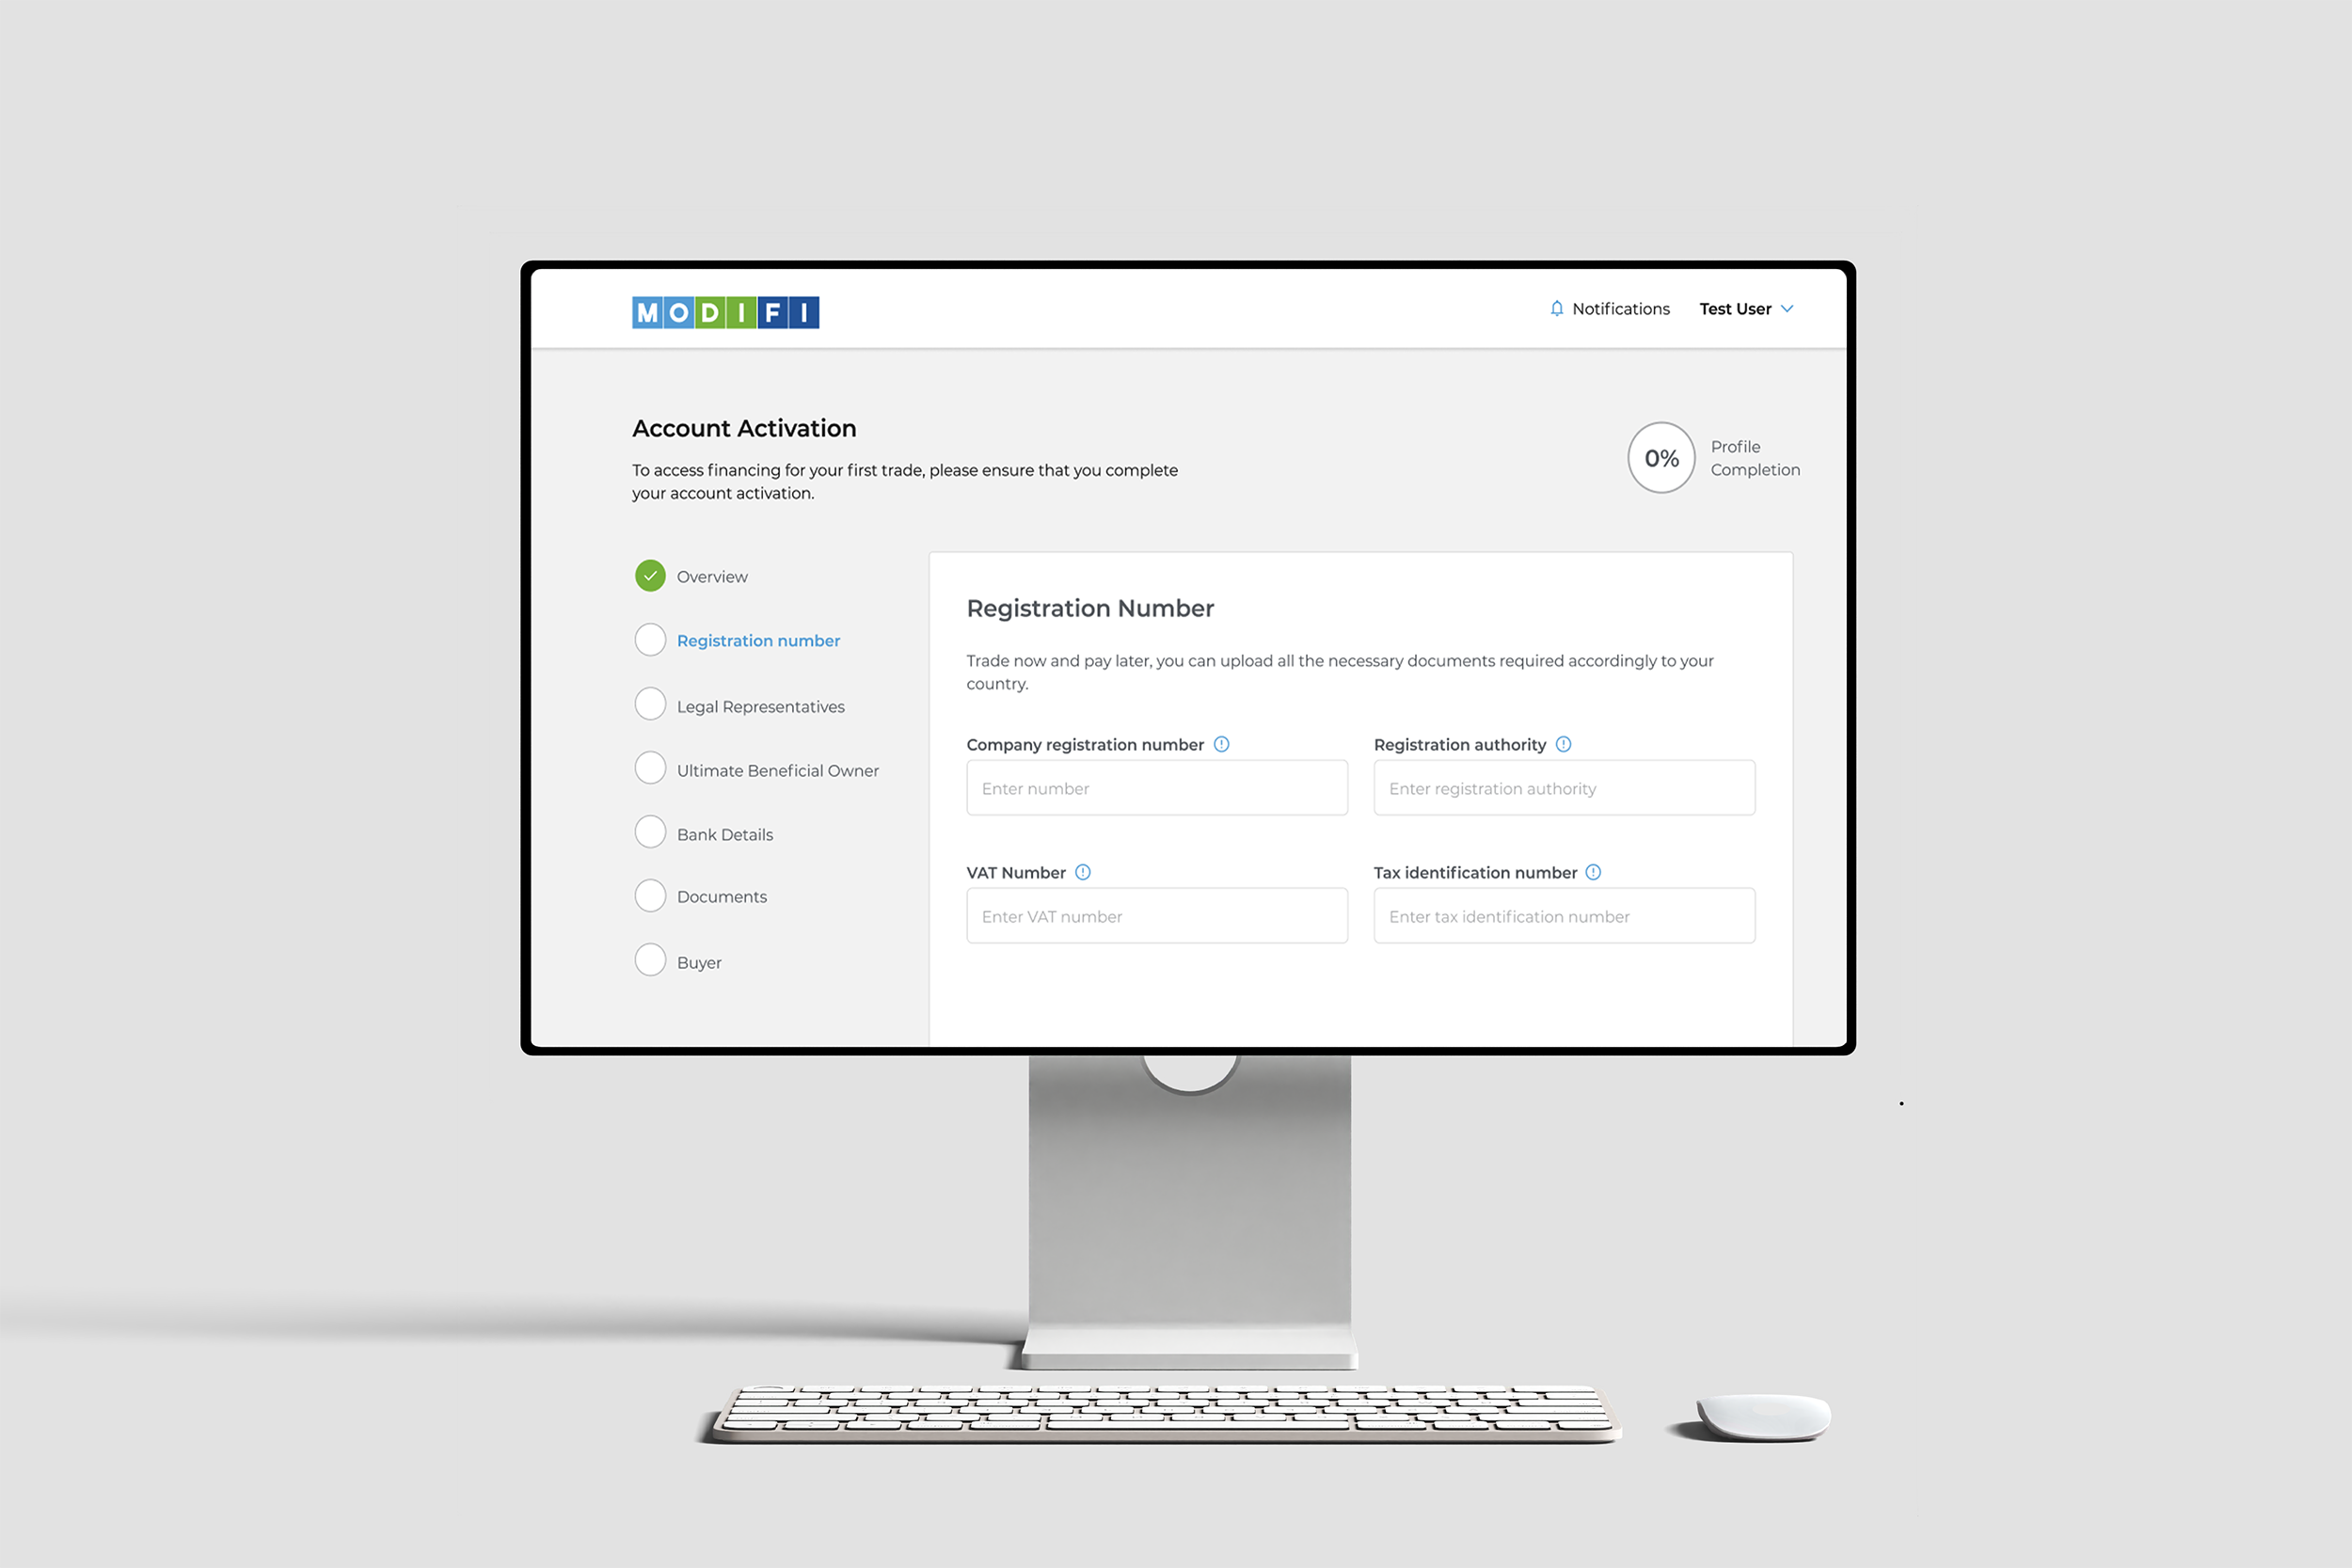
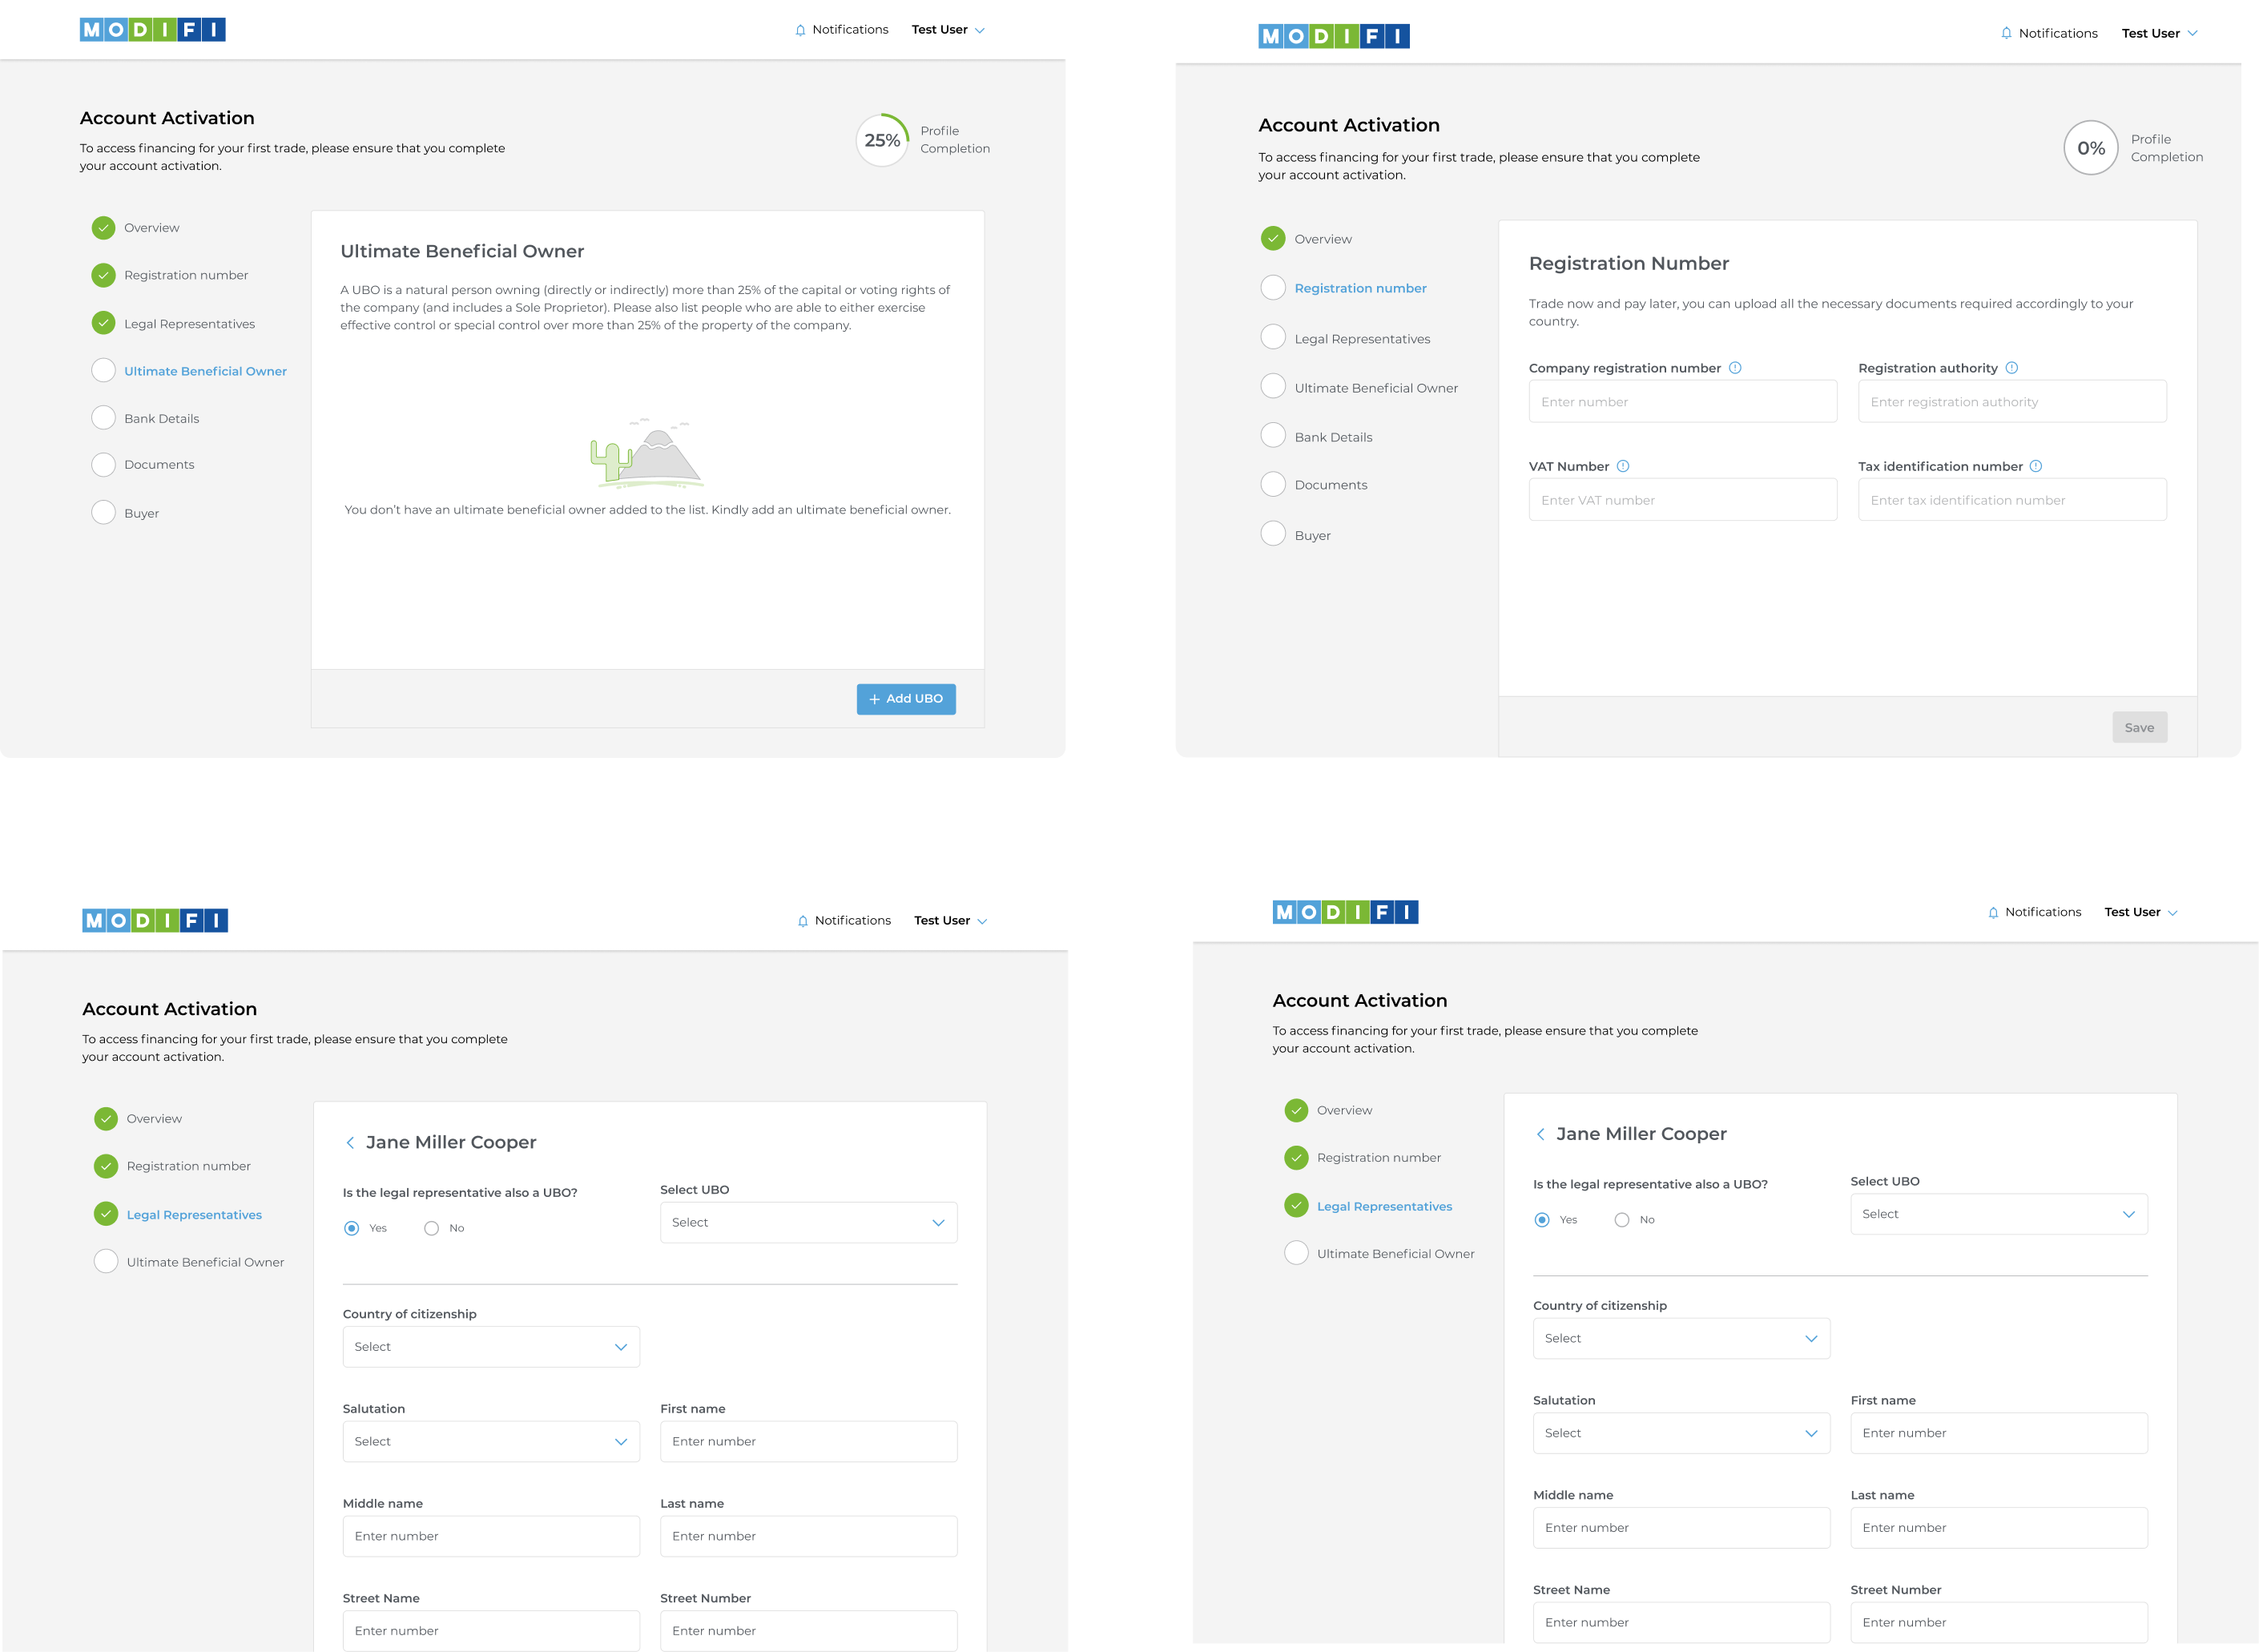
Account Activation Screens
The account activation flow was redesigned to make progress and next steps clearer throughout the process. I introduced a structured step-by-step layout with visible progress indicators so users always know where they are and what’s left to complete. Each section focuses on a single task, reducing overwhelm and helping users move through activation with more confidence and less friction.
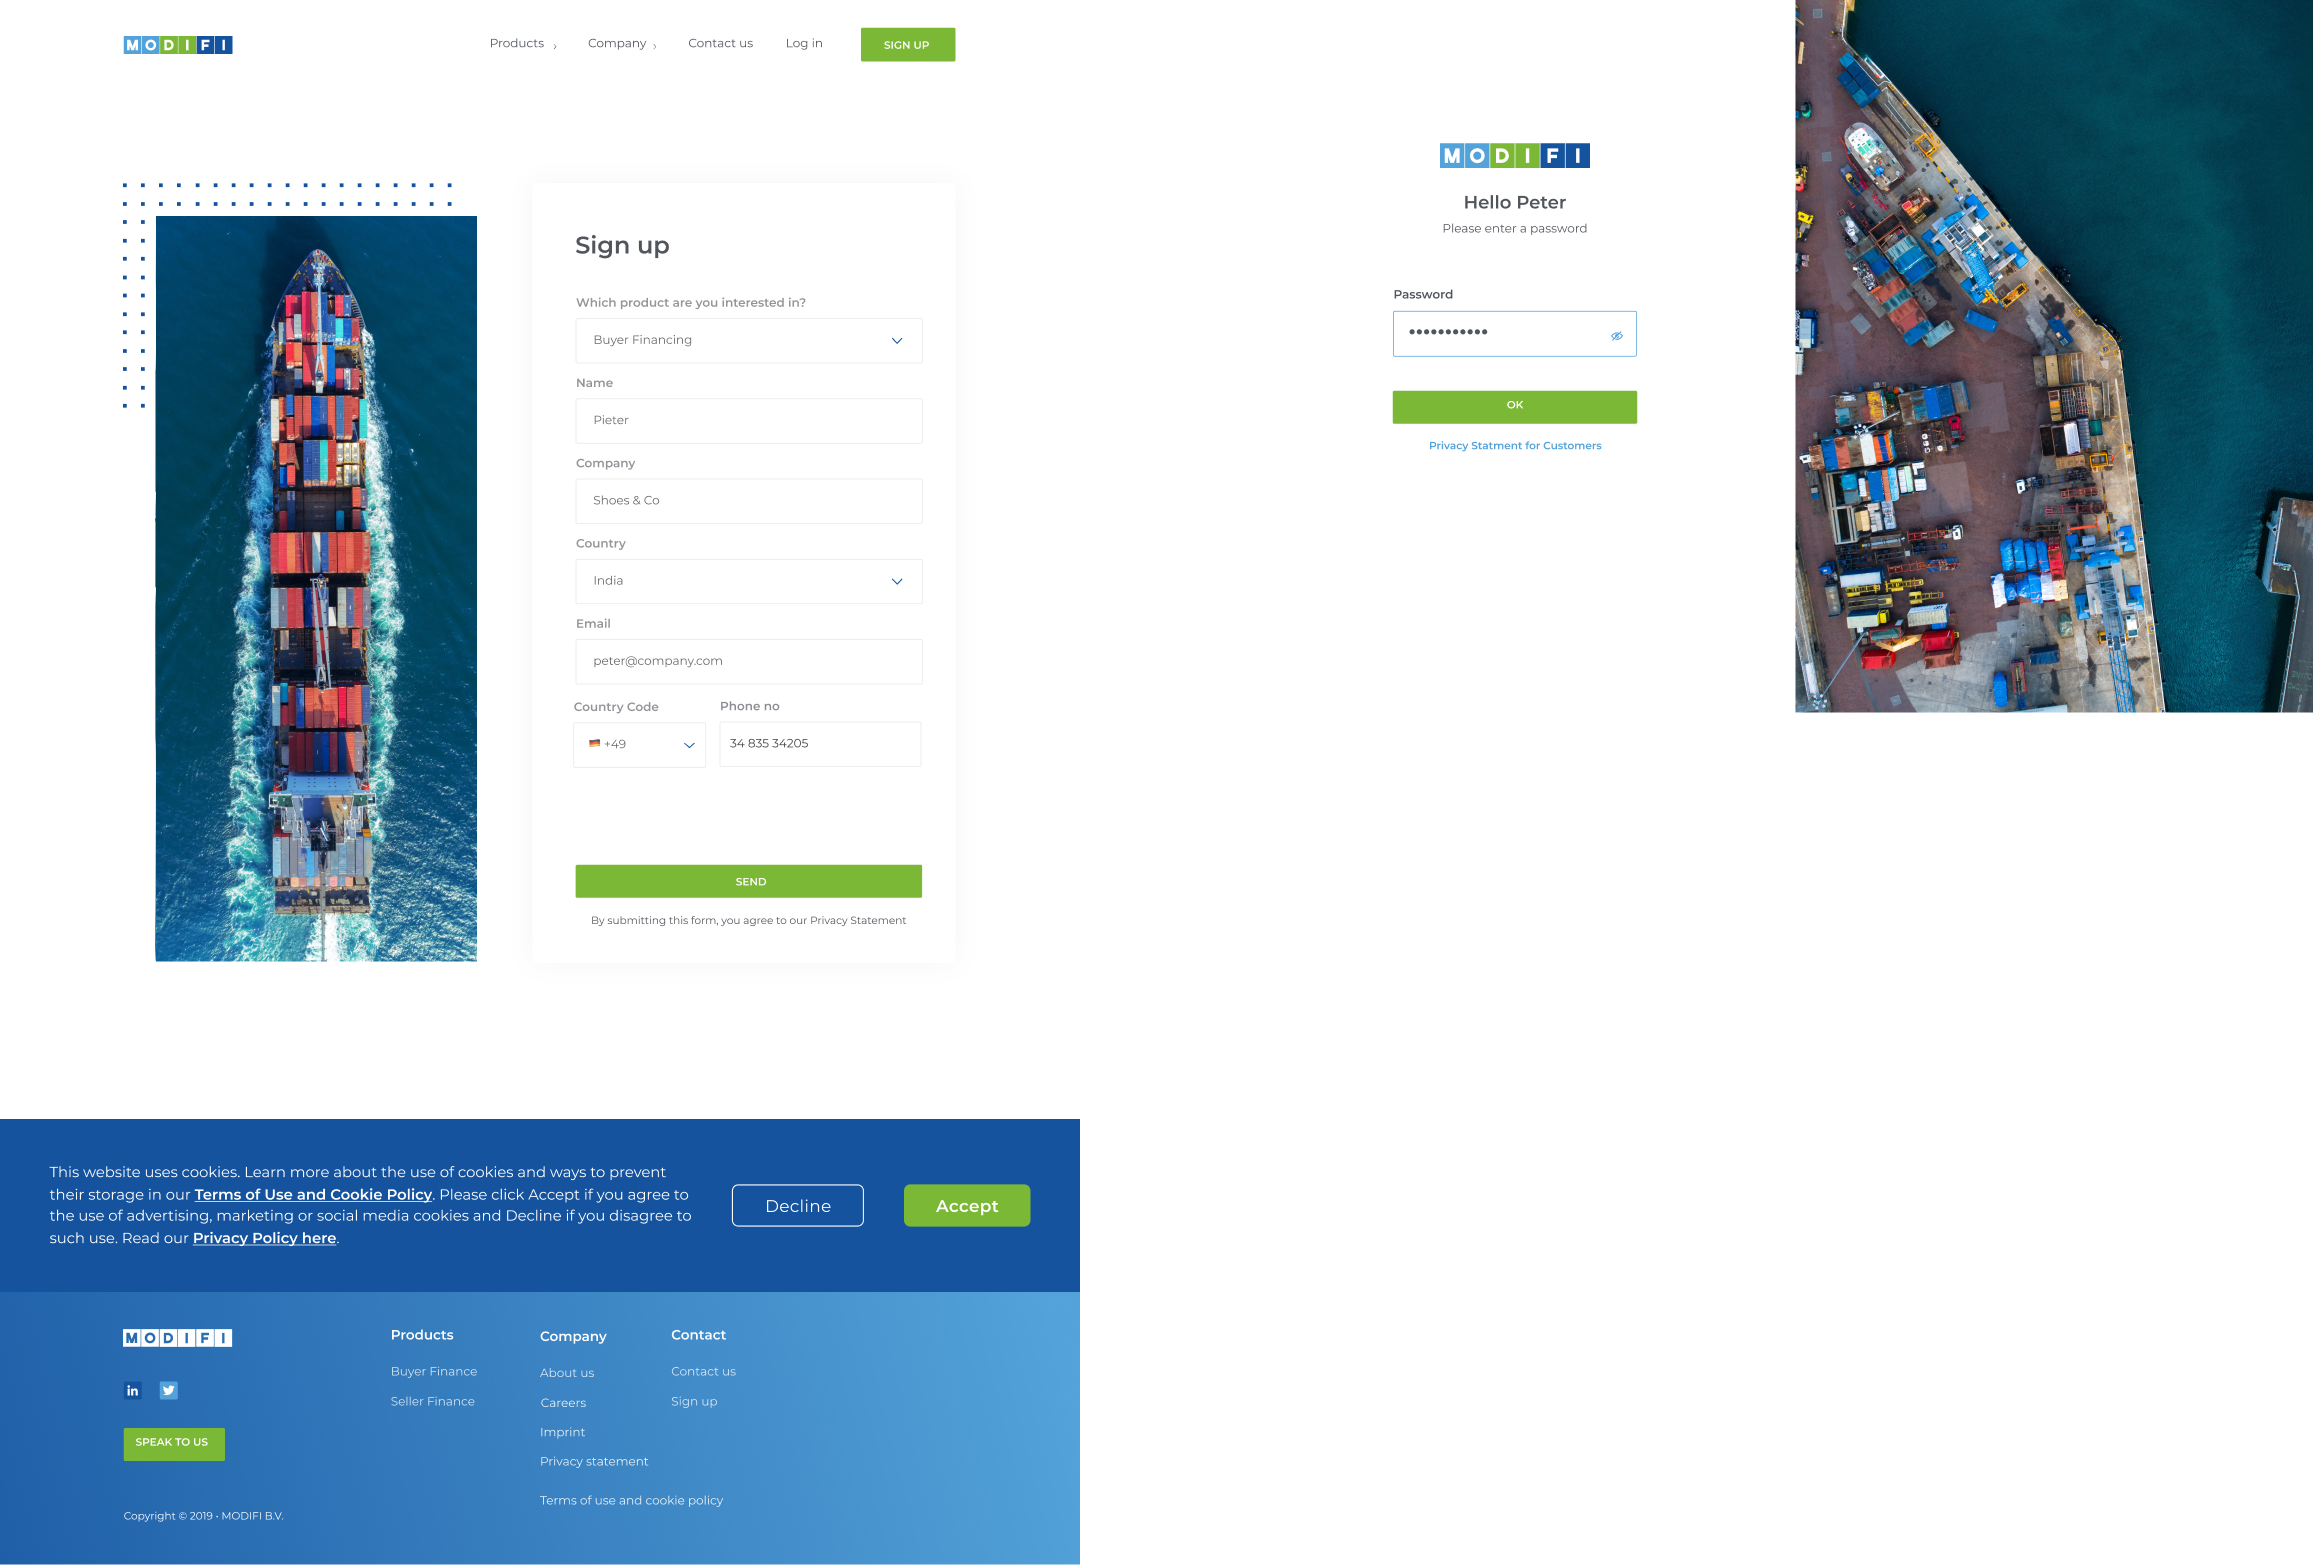
Sign Up
The sign up flow was simplified to make the first interaction feel quick and straightforward. I focused on reducing friction by keeping the form clean and easy to move through, with only the necessary inputs shown at each step. Visual elements add context without getting in the way, so users can complete the process without overthinking it.
Data-Driven Interface & State Management
Overview now gives users a clearer snapshot of their account, including repayment status and key metrics. These values are calculated directly from the underlying trade data, keeping the UI consistent and easy to maintain as the product evolves.
export function getOverviewMetrics(trades) {
  const totalTrades = trades.length;

  const totalTradeValue = trades.reduce(
    (sum, trade) => sum + trade.amount,
    0
  );

  const utilizationPercent = Math.round(
    trades
      .filter(t => t.status === "Approved" || t.status === "In Progress")
      .reduce((sum, t) => sum + t.amount, 0) / 200000 * 100
  );

  return { totalTrades, totalTradeValue, utilizationPercent };
}
For the Trades page, I designed the interface so users can refine results without switching views. Search, quick filters, and status selection each control their own piece of state, and are combined into a single dataset that determines what gets shown. This keeps the logic predictable and makes it easy to extend with additional filters over time.
const quickFilterMap = {
  "Action Required": ["In Review"],
  Completed: ["Approved"],
  "In Progress": ["In Progress"],
};
Key Takeaways
By restructuring the dashboard, onboarding flow, and trade views, the platform became easier to read and act on. Key information is now surfaced clearly, reducing friction and helping users make faster decisions.
+42%
Improved dashboard hierarchy made it easier to scan trade data and understand what matters without jumping between sections.
+30%
Simplified shipment tracking and added progress indicators so users can quickly see where things stand.
+20%
Clearer limit usage and repayment visibility helped users stay on top of their financial position and avoid missing key actions.